What Were the World's Busiest Airline Routes in 2025?
Welcome to OAG’s annual analysis of the world’s busiest flight routes, providing a comprehensive view of route performance and trends.
The Busiest Flight Routes of 2025 examines airline capacity across the world’s most popular air routes, using seat capacity data from January to December 2025 - powered by OAG’s Global Airline Schedules Data – we have ranked the busiest flight routes in the world.
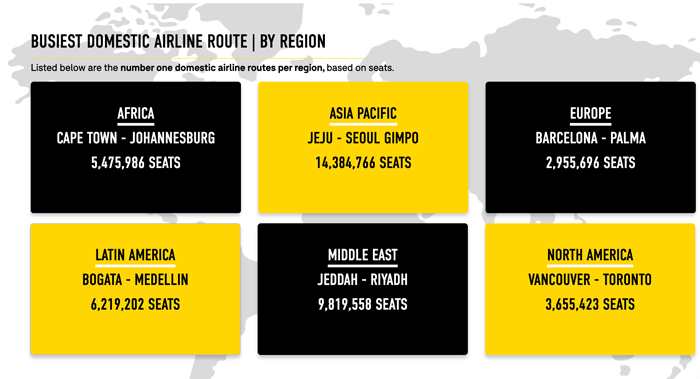
WHAT WERE THE BUSIEST AIRLINE ROUTES OF 2025?
Busiest Airline Routes of 2025
By seats
Nine of the Top Ten Busiest Routes operate in the Asia Pacific region.
The busiest airline route of 2025 is Jeju (CJU) to Seoul Gimpo (GMP):
- This route has 14.4 million scheduled seats in 2025, this is equivalent to almost 39,000 daily seats operating on this short sector of just 243 nautical miles.
- Capacity on the route is 1% above 2024 levels, but remains 17% behind 2019 levels.
- Seven carriers operate on this very competitive route.
- Airfares have dropped by 11% year-on year to $44 one-way.
The second and third placed busiest routes are both in Japan - which continues to maintain a strong position despite an extensive high speed rail network covering the country:
- Sapporo New Chitose (CTS) to Tokyo Haneda (HND) is in second place with a staggering 12.1 million seats in 2025; up 1% year-on-year and only 3% below pre-pandemic volumes, indicating near-full recovery.
- Fukuoka (FUK) to Tokyo Haneda (HND) is in third place growing by 1% vs 2024 with 11.5 million seats scheduled in 2025, this exceeds 2019 levels by 1%, making it one of the few major domestic routes to surpass pre-pandemic capacity.
Vietnam’s largest domestic route between
Hanoi (HAN) and Ho Chi Minh City (SGN) is the fourth busiest route:
- 1 million seats were scheduled in 2025, a 4% increase in year-on-year and 8% above 2019 levels.
- This route is highly competitive with six carriers operating in 2025.
- Airfares on this route have decreased by 11% year-on-year with the average one-way ticket costing $67.
The
fastest growing route in the top ten is fifth placed
Jeddah (JED) to Riyadh (RUH):
- Saudi Arabia’s flagship domestic route between the two largest cities in the Kingdom is the only route in the top ten outside of Asia Pacific.
- The route has increased by 13% YoY with 9.8 million seats in 2025 - in line with overall domestic growth this year in Saudi Arabia - and is now 22% above 2019 levels.
- Average economy airfares have also increased year-on-year by 27% to $95 one-way.
- Three airlines operate on this 460 mile route.
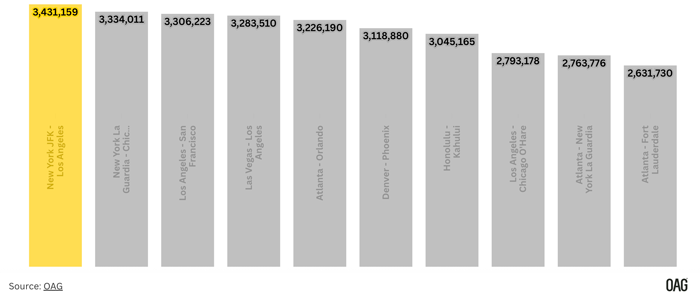
WHAT WERE THE USA'S BUSIEST DOMESTIC AIRLINE ROUTES OF 2025?
Busiest US Domestic Routes 2025
By Seats
The busiest domestic route in the USA in 2025 is
New York JFK (JFK) to Los Angeles (LAX), with 3.4 million seats. Capacity has grown by 9% compared with 2024, although it remains 20% lower than 2019 levels.
New York La Guardia (LGA) to Chicago O’Hare (ORD) is in second place, with 3.3 million seats, 7% increase YoY. Despite this annual growth, the route is still 13% below 2019 levels.
Los Angeles (LAX) to San Francisco (SFO) ranks third with 3.3 million seats, up 5% YoY; however, the route remains 29% lower than 2019.
Further down the rankings, the
Denver (DEN) to Phoenix (PHX) corridor stands out with 3.1 million seats, only 3% lower than last year but a substantial 23% above 2019. By contrast,
Honolulu (HNL) to Kahului (OGG) - the busiest US domestic route in 2023 - has fallen to seventh place, operating 3.0 million seats in 2025, a 10% reduction YoY; however, it is still 6% above 2019.
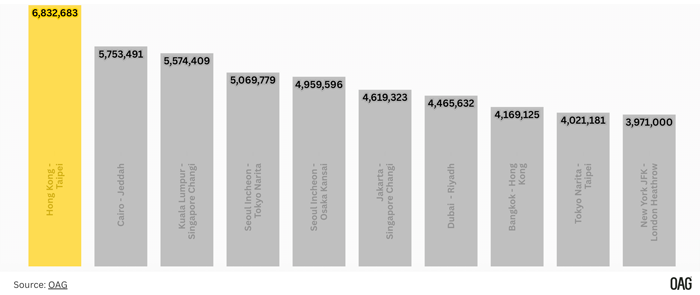
WHAT WERE THE TOP CROSS-BORDER AIRLINE ROUTES OF 2025?
Busiest Cross-Border Airline Routes of 2025
By seats
The busiest cross-border airline route in 2025 is Hong Kong (HKG) to Taipei (TPE):
- 6.8 million seats in 2025; a modest 1% increase compared with 2024, but capacity is still 14% below 2019.
- HKG to TPE has consistently ranked at the Top of the cross-border market, holding the same position as in 2024 and 2019.
- There are seven carriers operating on this route in 2025.
- The average fare is $115, down 6% on last year.
Cairo (CAI) and Jeddah (JED), a key Middle East trunk route, is in second place:
- 5.8 million seats in 2025; up 5% from 2024 and a striking 71% above 2019.
- LCCs now operate 43% of capacity on the route, and are driving growth, accounting for 81% of the additional seat growth this year.
- This strong growth reflects the strength of the relationship between these two neighbouring countries with people travelling for many reasons; business, leisure and visiting friends and relatives (VFR).
- Nine carriers operate on this route in 2025, highlighting its popularity.
- The average one-way fares of $145, down 12% on the previous year.
Asia’s second-largest cross-border route, and the third busiest globally, operates between two of Asia’s largest hubs
Kuala Lumpur (KUL) and Singapore Changi (SIN):
- 5.6 million seats in 2025; up 4% year-on-year returning capacity to 2019 levels.
- Served by seven carriers, it also has the lowest average economy fare among the Top 10 at just $62 one-way, highlighting intense competition.
Japan - South Korea routes remain prominent:
- Seoul Incheon (ICN) to Tokyo Narita (NRT) ranked fourth with 5.1 million seats, down 6% year-on-year but 58% above 2019. One-way fares are down 12% year-on-year at $140.
- Seoul Incheon (ICN) to Osaka Kansai (KIX) followed closely with 5.0 million seats, stable year-on-year and 44% above 2019. This route is also highly competitive, with 9 carriers operating on it; one-way airfares are -16% YoY.
- Both routes are heavily dominated by South Korean LCCs:
- ICN-NRT, only 7% of flights are operated by Japanese carriers, and the LCC share of flights is 68%.
- On ICN-KIX, 13% of flights operate on Japanese carriers, with a 77% LCC share.
The fastest-growing Top 10 route is
Jakarta (CGK) to Singapore (SIN):
- 14% year-on-year to 4.6 million seats, though still 16% below 2019.
- High competition with eight airlines vying for market share continues to suppress fares, averaging $87 one-way.
Middle East’s
Dubai (DXB) to Riyadh (RUH) route is in seventh place:
- 4.5 million seats in 2025; up 4% year-on-year and 42% above 2019, reflecting the steady strong demand for Middle East connectivity.
The only cross-border route in the Top 10 outside of the Middle East and Asia is
New York JFK (JFK) and London Heathrow (LHR) with 4.0 million seats in 2025:
- Capacity is marginally down 1% from 2024, but 4% higher than 2019.
- This route has the highest one-way economy fare in the Top 10 at $585 which has increased by 2% year-on-year, and five carriers operate this route.
Overall, seven of the Top 10 international routes in 2025 are in Asia, reflecting the region’s dominant role in global air travel. The remaining three routes cover the Middle East (Cairo–Jeddah, Dubai–Riyadh) and Europe–North America (New York–London). The majority of the increases in capacity year-on-year have been concentrated in Asia and the Middle East, demonstrating strong recovery momentum across these regions.
Copyright 2026 OAG Aviation Worldwide Limited. All rights reserved. From https://www.oag.com.